Fig. 4.

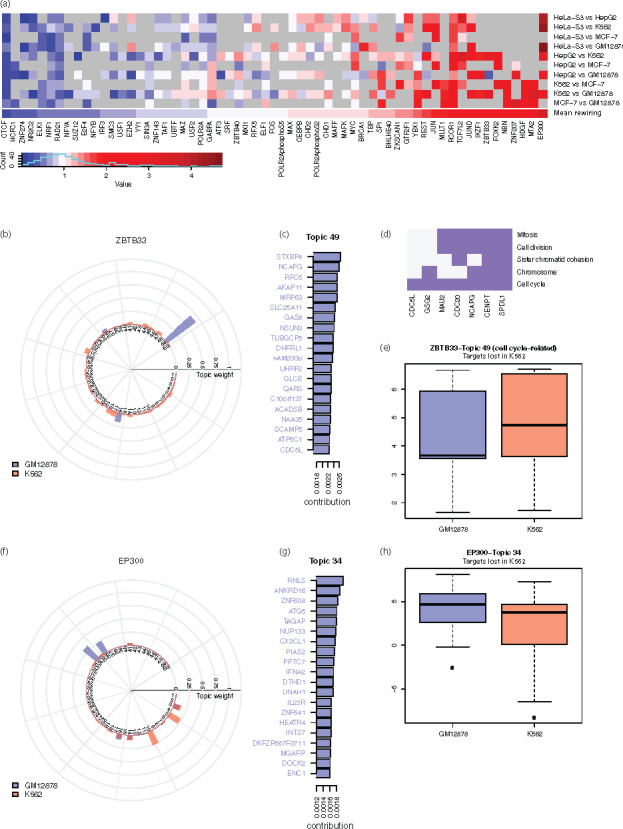
Quantified rewiring analysis using the identified topics. (a) Heatmap of rewiring of TFs in selected cell lines against GM12878 (gray grids correspond to unavailable data). (b) Topic weight for the rewiring event of ZBTB33 in GM12878 and K562. (c) Top-weighted genes of the two topics with greatest difference in the rewiring event of ZBTB33 in GM12878 and K562. Colored gene names indicate true regulatory targets in the ChIP-seq experiment. (d) Functional clustering of top-ranked genes of Topic 49 that are related to cell cycle and cell division. (e) Expression of the top-ranked genes of Topic 49 that are lost in K562. (f) Topic weight for the rewiring event of EP300 in GM12878 and K562. (g) Top-ranked genes of the two topics with the greatest difference in the rewiring event of EP300 in GM12878 and K562. Colored gene names indicate true targets in the ChIP-seq experiment. (h) Expression of the top-ranked genes of Topic 34 that are lost in K562
