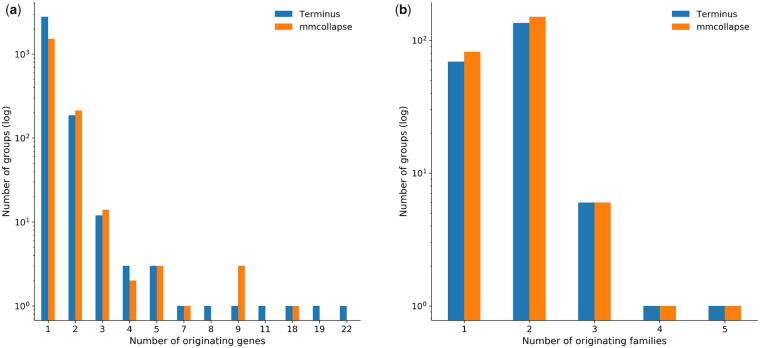
Fig. 6.
Biological significance of the groups produced by Terminus and mmcollapse. (a) The x-axis shows the number of genes that the transcript of the groups can be mapped back to, and the y-axis shows number of such groups. (b) The x-axis shows the number of gene families that the transcripts can be mapped back to, and the y-axis is the frequency of such mappings

