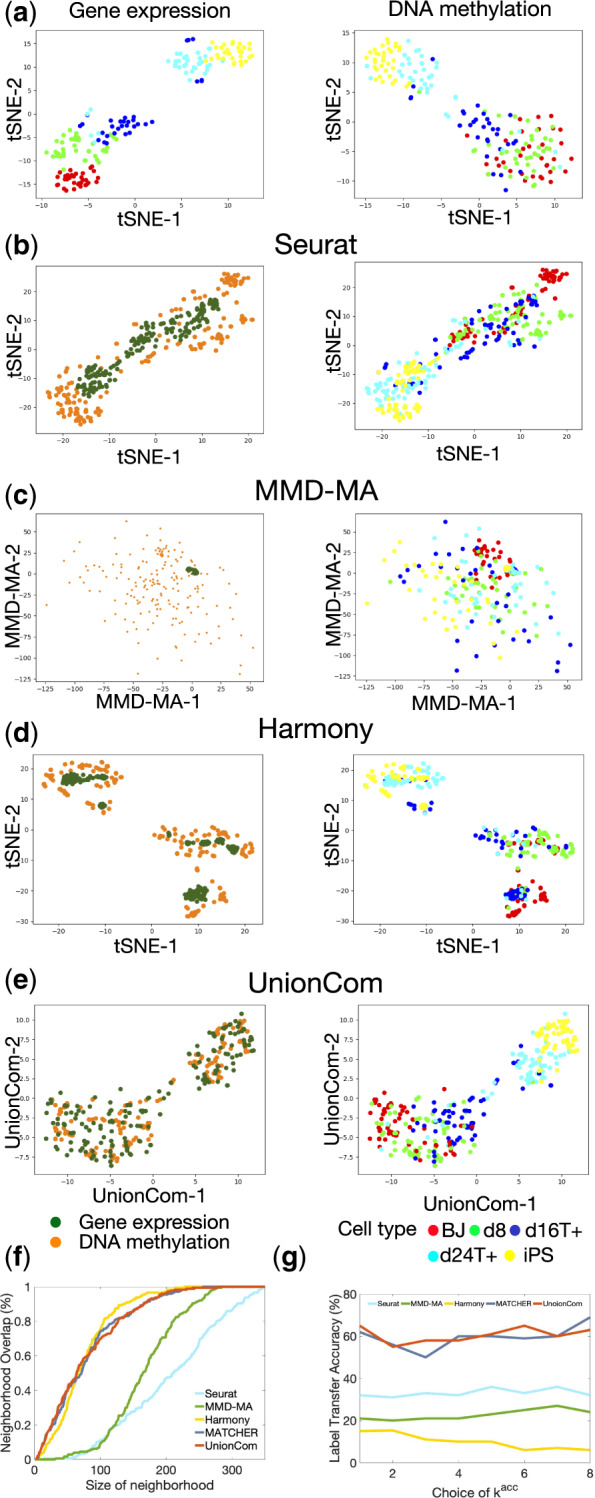
Fig. 4.

Alignment of sc-GEM omics datasets of gene expression and DNA methylation. (a) Visualizations of the gene expression and DNA methylation datasets separately using t-SNE before alignment. Visualizations of the common embedding space of the two aligned datasets by Seurat (b), MMD-MA (c), Harmony (d) and UnionCom (e), respectively [left panel: points (cells) are colored according to their corresponding datasets; right panel: points (cells) are colored according to their corresponding cell types]. (e) Averaged percentage of Neighborhood Overlap at different size of neighborhood. (f) Label Transfer Accuracy at different kacc of the kacc-nn classifier
