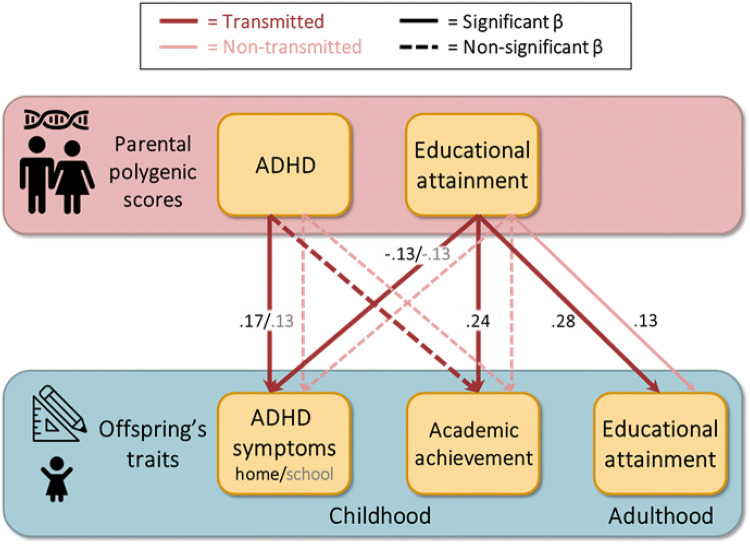
Fig. 3.
Schematic overview of the results. Note Dark lines represent the effect of transmitted polygenic scores and light lines represent the effect of non-transmitted polygenic scores. Solid lines represent a significant effect and dashed lines represent a non-significant effect. The depicted effects are the estimates for the regression coefficients as estimated for educational attainment and academic achievement in model 1 and for ADHD symptoms in model 2

