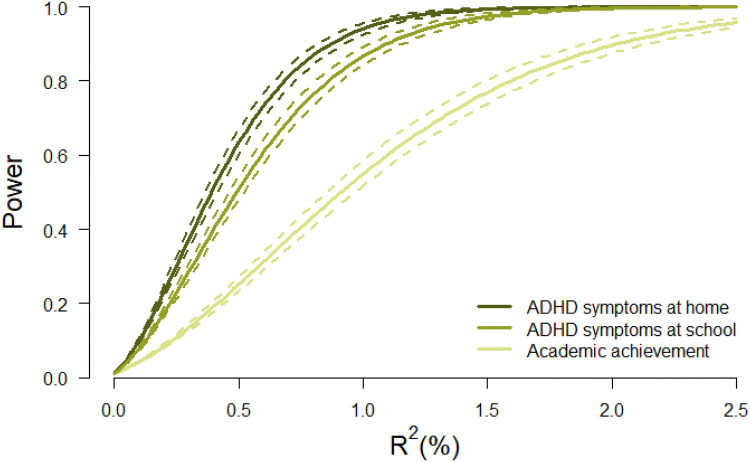
Fig. 4.
Power to detect the fixed effect of the non-transmitted PGS (expressed in R2) based on the calculated effective sample sizes for academic achievement (Neffective = 727), ADHD symptoms at home (Neffective = 1702) and ADHD symptoms at school (Neffective = 1352). Note Effective sample sizes are calculated with the formula (N*M)/(1 + ICC*(M−1)) in which N the number of families, M the number of individuals in a family and ICC the (average) phenotypic correlation within a family. Solid lines represent power with effective sample sizes calculated with the intraclass correlation (ICC) based on phenotypic correlations between family members for academic achievement (rMZ = 0 .8; rDZ/SIB = 0.4), ADHD symptoms at home (rMZ = 0.8; rDZ/SIB = 0.3) and ADHD symptoms at school (rMZ = 0.8; rDZ/SIB = 0.3). Dashed lines represent the power with effective sample sizes calculated with lower (r−0.1) and higher (r + 0.1) phenotypic correlations

