
Fig. 1.
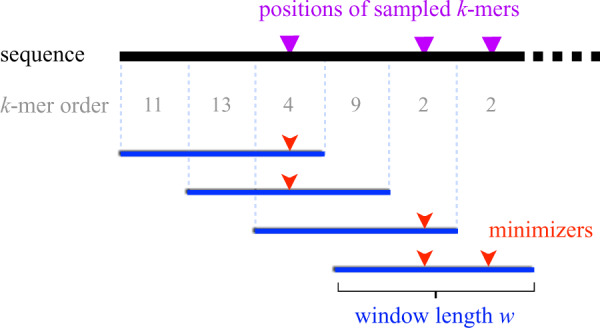
Visualization of the minimizer sampling technique (Roberts et al., 2004). The sequence being sampled is shown as a black line. Assuming a pre-defined order of k-mers (e.g. lexicographical), the sampling selects each of the smallest k-mer(s) (shown as red arrows) in consecutive sliding windows (shown as blue intervals). The length of each window, i.e. w is three in the above example