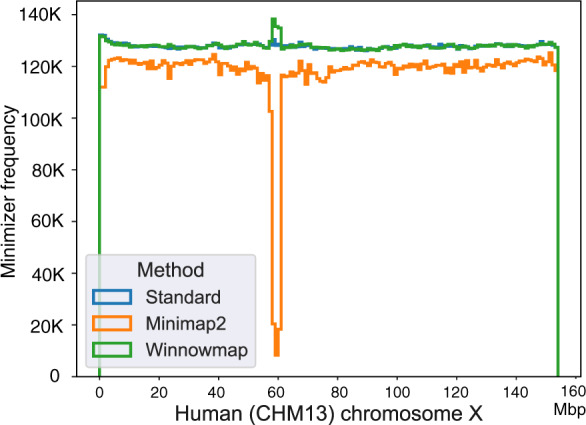
Fig. 4.

Step histogram plot showing frequency of minimizers sampled using a complete human chromosome X as the reference. Frequency of minimizers was computed in each consecutive ‘super-window’ of length 1 Mbp across the reference sequence. We compare three sampling algorithms using window length parameter w = 10. ‘Standard’ method refers to the classic minimizer sampling algorithm from Roberts et al. (2004), without any masking or modification. Minimap2 uses the standard algorithm, but masks the most frequently occurring minimizers (top 0.02%) in the reference (count for this reference). Winnowmap uses weighted minimizer sampling. Both ‘Standard’ and Winnowmap methods maintain at least one minimizer per window in their index and achieve near-uniform density. The masking heuristic in Minimap2 reduces minimizer density throughout the chromosome X, and a significant drop is observed in its long repetitive centromere (58–61 Mbp). Interestingly, we also observe a slight increase in Winnowmap’s minimizer density in this region
