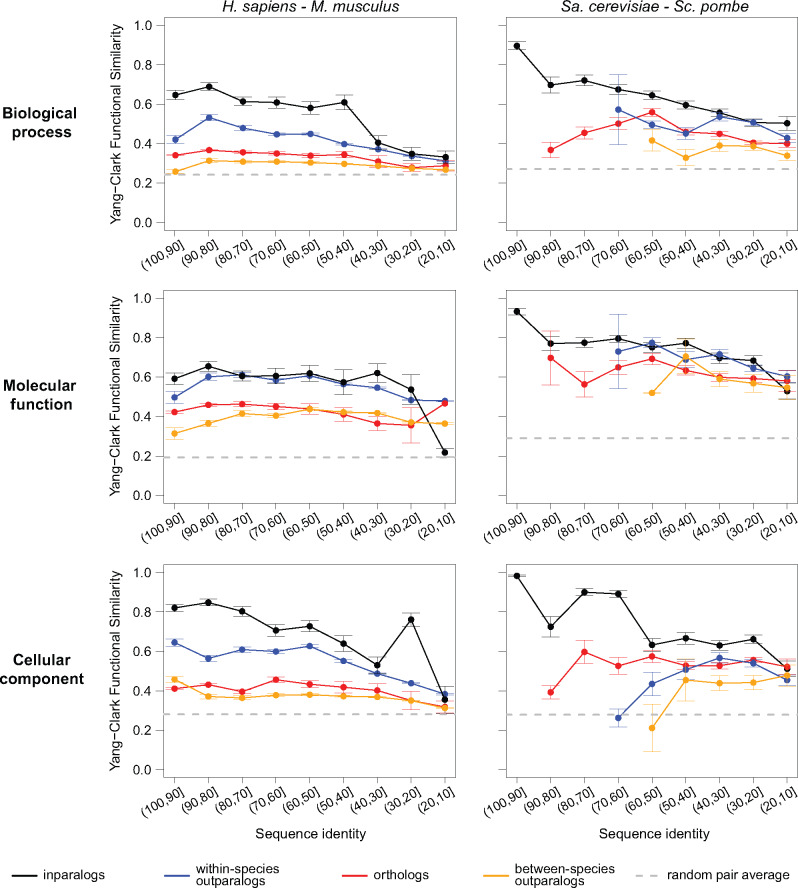
Fig. 2.
Left: The relationship between Yang–Clark functional similarity and sequence identity for human and mouse over three different ontologies in GO. The breakdown is presented for four types of homologous relationships between pairs of proteins (orthologs, between-species outparalogs, within-species outparalogs and inparalogs). The dashed line in each panel shows the estimated functional similarity for a randomly selected pair of proteins, obtained by averaging 1000 randomly selected proteins from the available pool. The data are presented for each sequence identity bin in which at least three pairs of proteins could be used to calculate functional similarity. Right: The relationship between Yang–Clark functional similarity and sequence identity for Sa.cerevisiae and Sc.pombe over three different ontologies in GO. The breakdown is presented for four types of homologous relationships between pairs of proteins (orthologs, between-species outparalogs, within-species outparalogs and inparalogs). The dashed line in each panel shows the estimated functional similarity for a randomly selected pair of proteins, obtained by averaging 1000 randomly selected proteins from the available pool. The data are presented for each sequence identity bin in which at least three pairs of proteins could be used to calculate functional similarity. The results in which term frequencies were separately computed over each pair of species are very similar, as presented in Supplementary Figure S1

