
Fig. 3.
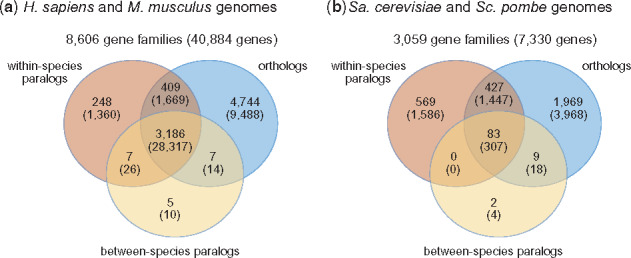
The numbers of gene families with different types of homologous relationships in them. The numbers in parentheses represent the counts of genes in the respective gene families. (a) Gene families containing H.sapiens and M.musculus proteins and (b) gene families containing Sa.cerevisiae and Sc.pombe proteins