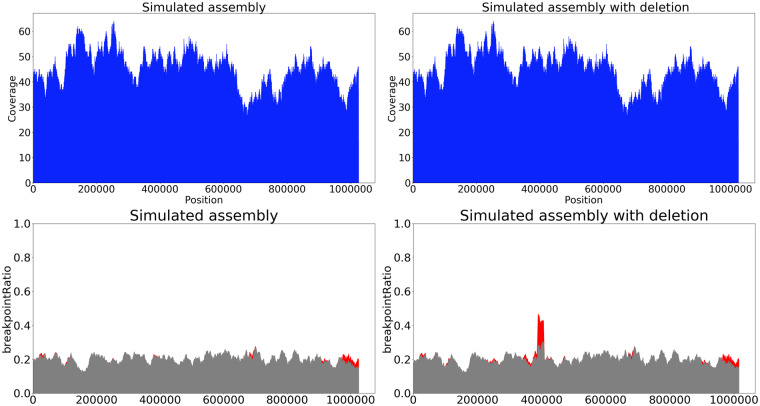
Fig. 3.
Coverage (top) and breakpoint (bottom) metrics for simulated (left) and simulateddel (right) assemblies. The coverage plot does not show a significant drop at the point of the deletion but the breakpoint plot reveals peak at the position of the deletion (400 kb). The red plot is based on the breakpointRatio(Kmer) values, the gray plot is based on the breakpointRatio+(Kmer) values

