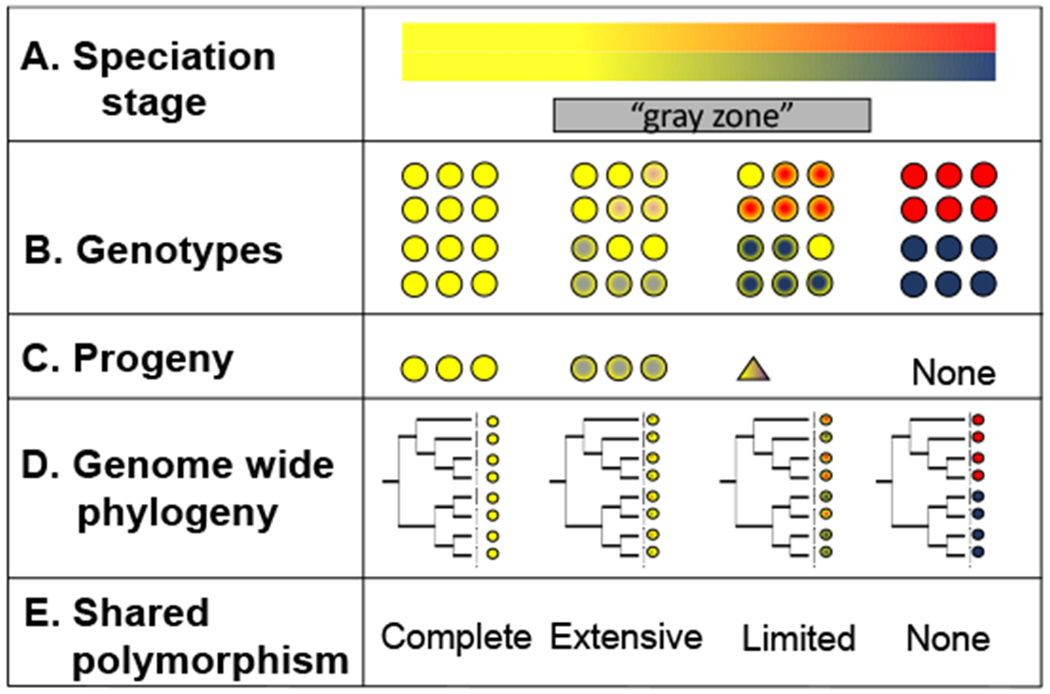
FIGURE 1. Simplified representation of the process of speciation continuum and the different signatures of speciation.

A. Speciation stage: genetic differences accrue in the nascent species to the extent that they become fully differentiated. Detecting speciation can be difficult in cases where divergence is recent (i.e., the gray zone). B. Genotypes: genetic differentiation will manifest in differences in the allele frequencies of the resulting populations (middle panel). Genetic differentiation might also lead to phenotypic differences but that is not always the case. C. Progeny: as divergence accumulates, the resulting species are less likely to interbreed and produce fit progeny to the extent that interbreeding will cease completely (bottom panel). D. Genome wide phylogeny: before speciation occurs (left), populations will exchange genes and polymorphic sites across the genome will be present in both species. As divergence accrues, the likelihood of reciprocal monophyly across the genome increases, and the likelihood of shared polymorphism decreases. Speciation is complete when genomes become reciprocally monophyletic, the magnitude of shared polymorphism is negligible, and reproductive isolation precludes the possibility of admixture. E. Level of shared polymorphism.
