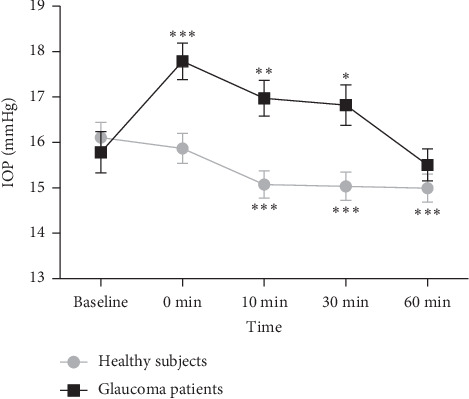
Figure 1.

Intraocular pressure (IOP) fluctuation before (baseline) and after (0, 10, 30, and 60 minutes) visual field testing in healthy subjects and glaucoma patients. ∗∗∗P < 0.001, ∗∗P < 0.01, and ∗P < 0.05 compared with baseline (one-way repeated-measures ANOVA followed by Bonferroni correction). Error bar denotes SEM.
