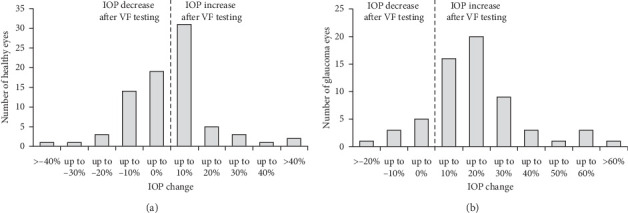
Figure 2.

Distribution of intraocular pressure (IOP) change immediately after visual field (VF) testing in healthy eyes (a) and glaucoma eyes (b). IOP change is defined as a percent change in IOP measured immediately (0 minute) after the VF testing compared with the IOP measured before VF testing (baseline). 13.8% and 7.5% of the healthy eyes experienced >10% and >20% IOP increase, whereas 59.7% and 27.4% of the glaucoma eyes experienced >10% and >20% IOP increase.
