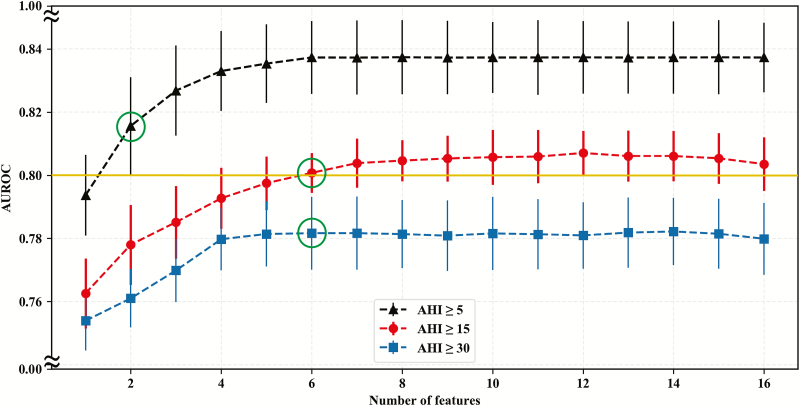
Figure 3.
This figure illustrates the relationship between AUROC of prediction model and corresponding numbers of features in the stepwise forward feature selection. The results show that fewest numbers of features to achieve AUROC ≥ 0.80 were 2, 6, and 6 for AHI ≥ 5/h, 15/h, and 30/h, respectively. The solid dot and bar indicated mean and standard deviation, respectively. The green circles indicated selected feature numbers with specific AHI cutoff.

