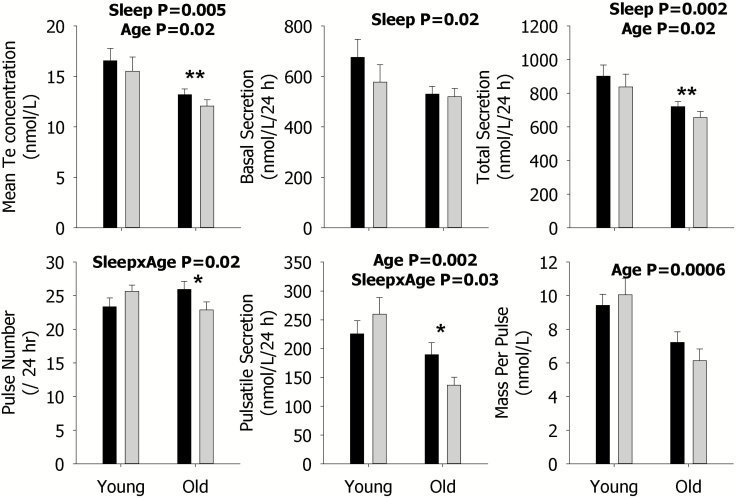
Figure 1.
Data are the mean ± SEM of parameters of Te secretion during rested sleep (black column) or restricted sleep (gray column) in young (left) and older (right) men within each panel. The mean concentration (left), basal secretion (middle), and total secretion (right) are shown in the upper panels; and pulse number (left), pulsatile secretion (middle), and mass per pulse (right) are illustrated in the lower panels. Statistically significant Sleep, Age, and SleepxAge effects are shown by the p-value. Statistically significant contrasts between the rested sleep and restricted sleep conditions in young or older men are shown by *p < 0.05 (Bonferroni adjusted) or **p < 0.0167 (Bonferroni adjusted). The absence of asterisks indicates that a significant contrast was not observed.

