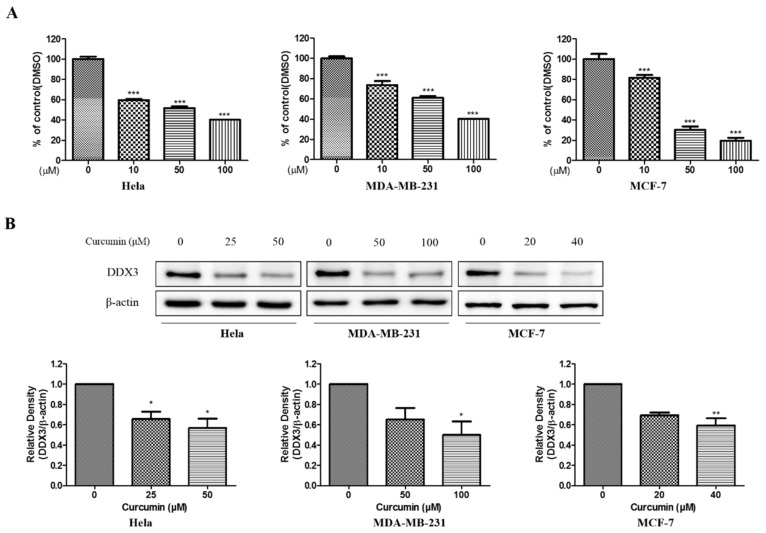
Figure 8.
The cytotoxic effects and DDX3 protein expression on curcumin in HeLa, MDA-MB-231, and MCF-7 cell lines. (A) The cells were treated with the curcumin as various concentrations (0–100 μM) for 24 h. Then, the cell viability was measured by MTT assay. (B) The curcumin was treated with indicated concentration each cell lines for 24 h. Western blot analysis were conducted to identify the DDX3 protein expression. The β-actin protein was used as loading control. * p < 0.05 vs. untreated group; ** p < 0.01 vs. untreated group; *** p < 0.001 vs. untreated group.

