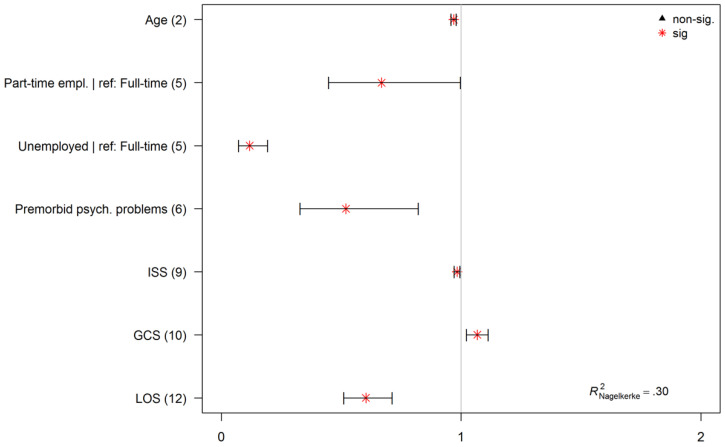
Figure 4.
Odds ratios for the final model predicting probability of being employed one-year after TBI. Asterisks (*) indicate significant factors or factor levels. Values < 1 represent factors and factor levels with decreased probability of being employed one-year after TBI; values > 1 indicate for a higher probability of employment. Numbers in parentheses are referred to Table 1. The optimism-corrected Nagelkerke’s R² demonstrates the relative information gain of the final model compared to the null model (model without predictors, and intercept only).

