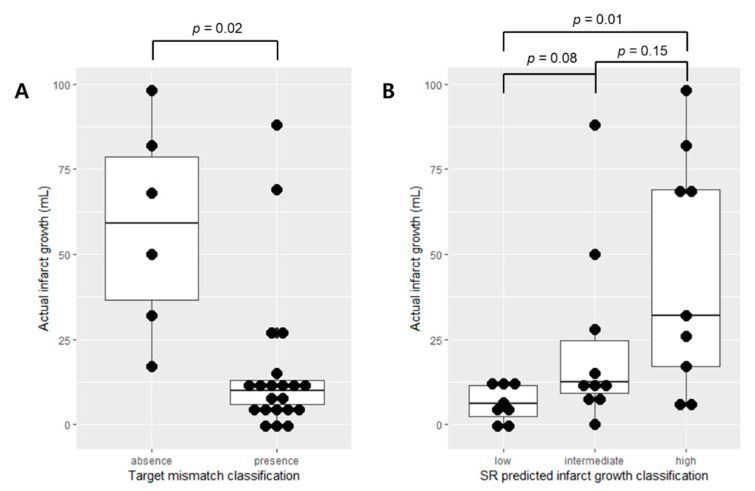
Figure 4.
Infarct growth distribution in the external validation SR patients (n = 27). (A) Target mismatch classification. (B) SR-predicted infarct growth classification. In (A), the mismatch absence group shows a heterogeneous distribution of actual infarct growth. In (B), the high group (SR-predicted infarct growth ≥ 35 mL) shows a heterogeneous distribution of actual infarct growth, and the low group (SR-predicted infarct growth < 15 mL) shows the narrowest distribution of the actual infarct growth.

