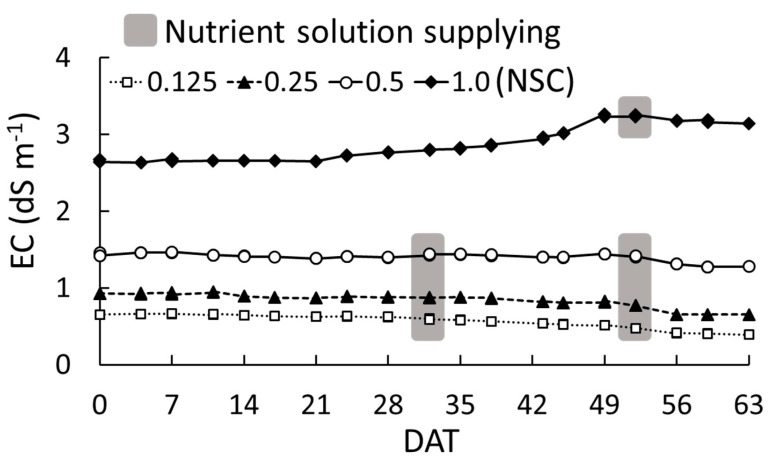
Figure 1.
Change in electrical conductivity (EC) in each nutrient solution concentration (NSC) for 63 days after the start of the treatment (DAT) in experiment 1. The treatments were 0.125, 0.25, 0.5, and 1.0 NSC. The 1.0 NSC was the standard concentration of Otsuka-A nutrient solution. The grey marked DATs indicate the timing of the supply of the nutrient solution.

