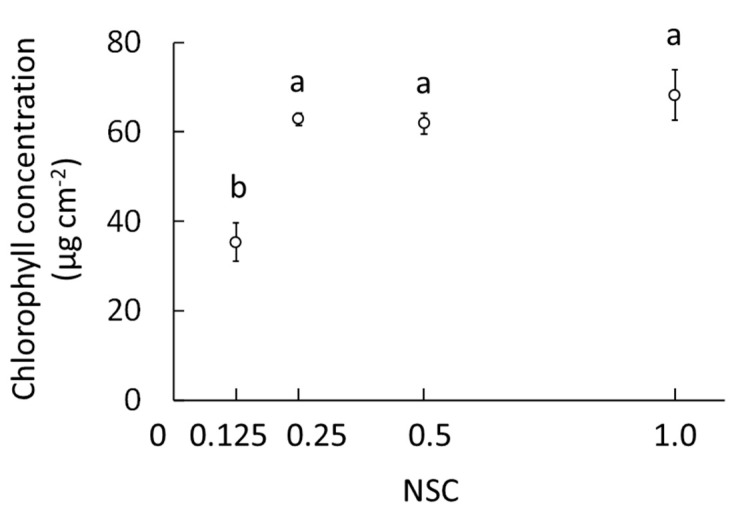
Figure 4.
Effects of nutrient solution concentration (NSC) on the chlorophyll concentration in young leaves of O. pumila at 63 days after the start of the treatment (DAT) in experiment 1. The treatments were 0.125, 0.25, 0.5, and 1.0 NSCs. Vertical bars indicate S.E. (n = 8). Different letters indicate significant differences among the treatments at p < 0.05 by Tukey–Kramer’s test.

