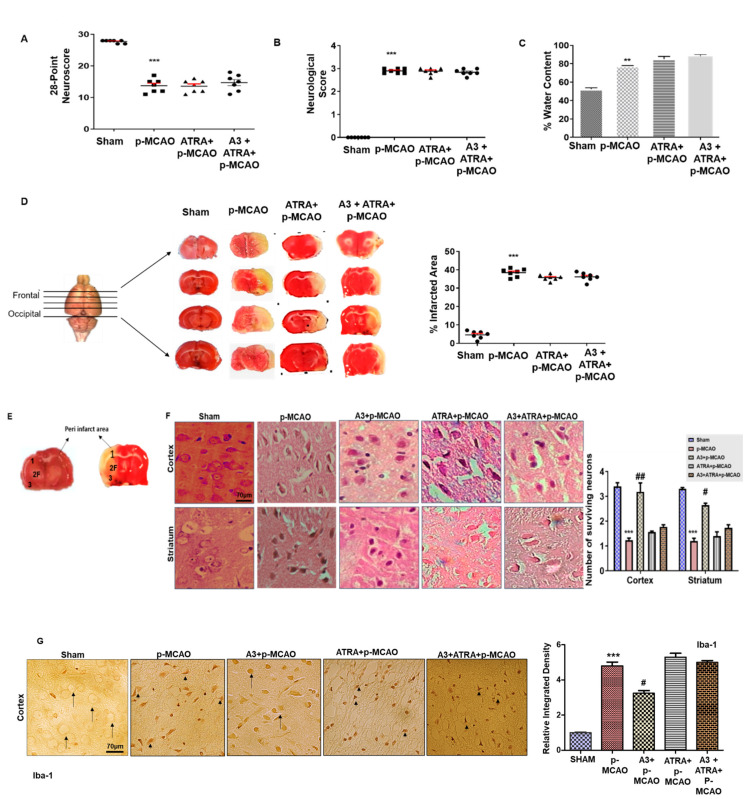
Figure 4.
Effects of ATRA on A3 mediated neuroprotection. (A) 28 points composite scoring. (B) Bederson scale. ATRA+p-MCAO rats exhibited severe neurological impairment as with p-MCAO (n = 7/group). (C) The brain water content of the cerebral hemisphere in the ischemic side in each group (n = 5/group). ** p < 0.01 vs. sham group. ATRA+p-MCAO showed no significant changes in % water content/edema formation as compared to p-MCAO. (D) % Infarct area was quantified by TTC staining started from the frontal cortex to the occipital cortex, which differentiates between ischemic and non-ischemic areas (n = 7/group). (E) Coronal sections indicating frontal cortex (1), parietal cortex and insular cortex (2), and the piriform cortex (3). The analyzed region of interests indicated by 1 and F. (F) Representative images of hematoxylin and eosin staining in various groups. Scale bar = 70 μm. magnification 40×. (G) Representative images of Iba-1 immunostaining in the cortex. Scale bar = 70 μm, magnification 40×. The thin arrows indicated normal neuronal cells while the arrowhead indicates microglial phenotype. *** p < 0.001 vs. sham, # p < 0.05 and ## p < 0.01 vs. p-MCAO group.

