Figure 2.
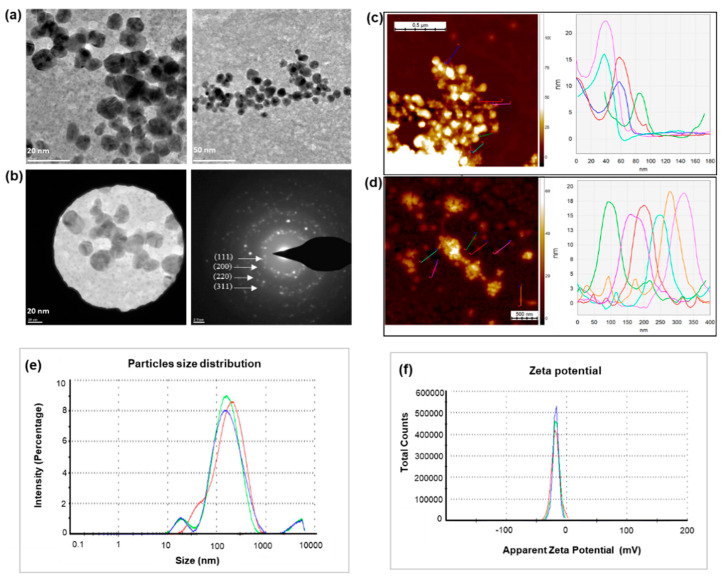
(a) Transmission electron microscopy (TEM) images of AgNPs showing the particles shapes, and (b) selected area diffraction pattern (SAED) of AgNPs with respective SAED apertures. The figures represent the size of nanoparticles of 80–120 nm with crystalline nature. AFM analysis of nanoparticle, (c) Z-height 128 nm, (d) Z-height 70 nm. (e) Particles size distribution with respect to the AgNPs intensity. (f) Zeta potential analysis, which shows the surface charge of nanoparticles with respect to total number of nanoparticles present in the solution. The study was done in triplicates and the results are an average of three analyses.

