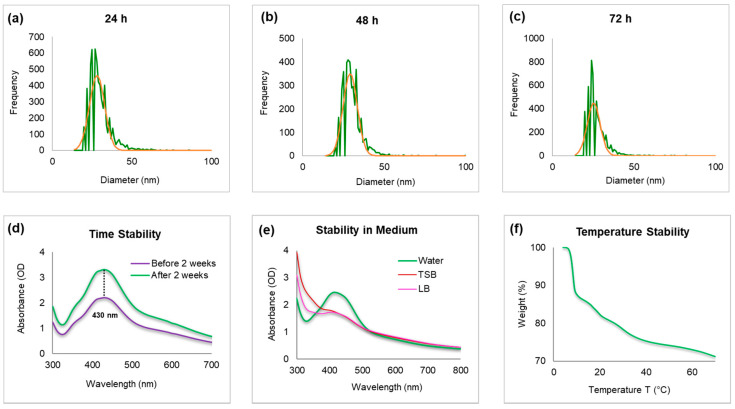
Figure 4.
Inductively coupled plasma-mass spectrometry (ICP-MS) measurement of freshly prepared nanoparticles, which shows the size distribution histogram. (a) ICP-MS measurement of AgNPs after 24 h, (b) 48 h, and (c) 72 h of nanoparticles incubation to analyze the nanoparticles stability (the green color shows the frequency of size distribution and red is mean value). The dwell time was set to 50 µs and the scan time to 100 s. UV/Vis spectra for nanoparticles (d) time-dependent stability at a difference of two weeks, and (e) stability in bacteriological media. (f) Thermogravimetric analysis (TGA) measurement of nanoparticles, which shows the complete nanoparticles degradation at high temperature.

