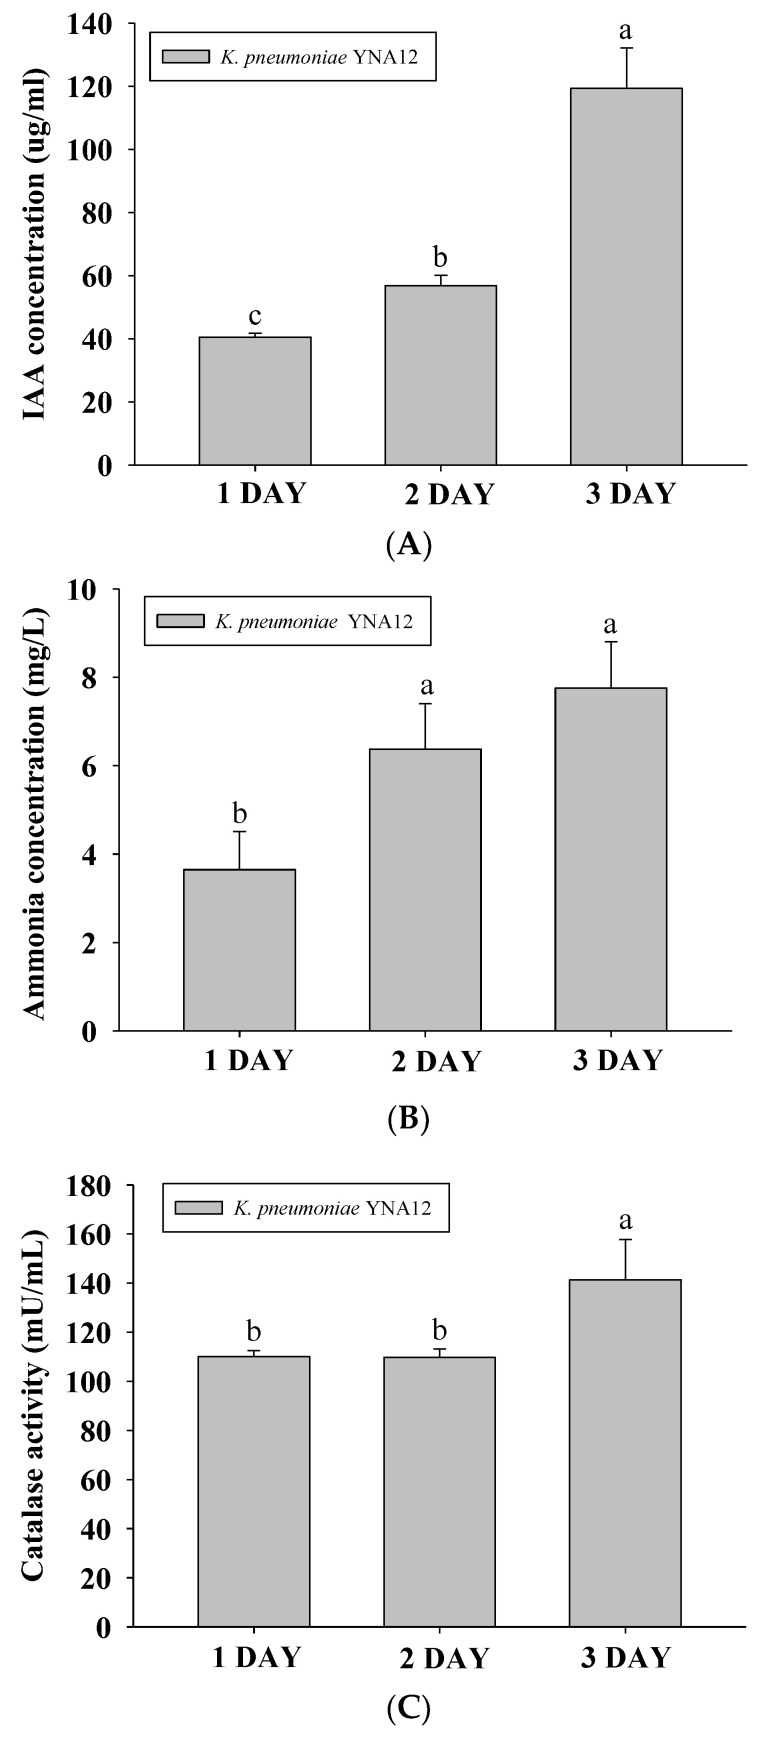
Figure 3.
Quantification of indole-3-acetic acid (IAA) (A), ammonia (B), and catalase (C) produced by endophytic YNA12: Values and error bars represent the mean ± standard deviation (n = 3). Means followed by the same letter (a, b, and c) are not significantly different (p ≤ 0.05) according to Duncan’s multiple range test.

