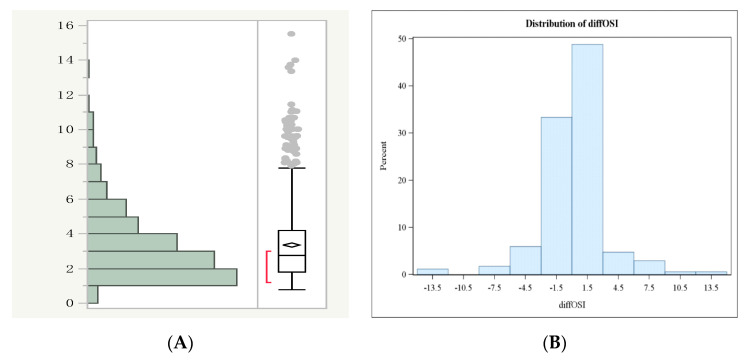
Figure 1.
(A) Skewed distribution of OSI values (left) and the normal distribution after logarithmic conversion together with the diagram of quartiles (right). The cycles were subdivided into three subgroups according to the quartile of the OSI distribution: (a) the OSI < 0.17 (lower than the 25th quartile; low OSI; n = 623), (b) OSI 0.17–1.59 (between the 25th and the 75th quartile; the intermediate OSI; n = 1846), and (c) the OSI > 0.59 (higher than 75th quartile; high OSI, n = 884). (B) The distribution of the difference in the OSI (diffOSI) observed in patients who underwent two consecutive COS cycles changing the COS regimen from GnRH-agonist long protocol to GnRH-antagonist protocol (or vice versa). Only 18% of the patients showed a diffOSI > 1.5 between one COS protocol and the other.

