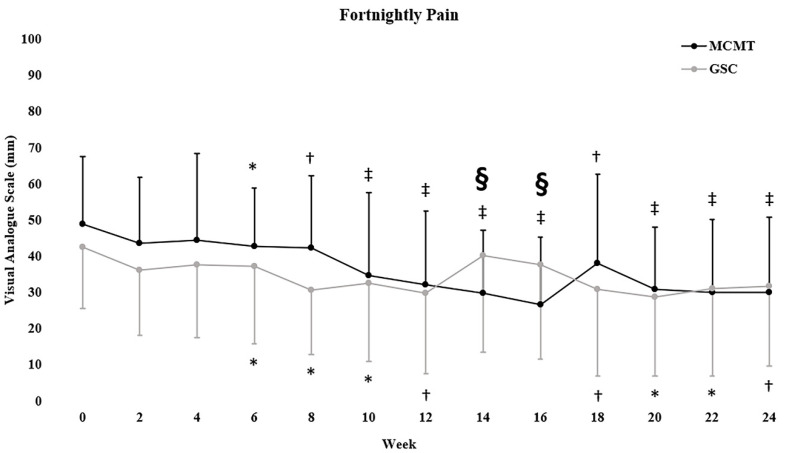
Figure 3.
Mean ± standard deviation fortnightly pain (VAS) data. § p < 0.01 indicates significant between-group effect at that week. * p < 0.05, † p < 0.01, ‡ p < 0.001 indicate within-group change. Symbols above error bars refer to significant changes within the MCMT group, symbols below the error bars to the GSC group.

