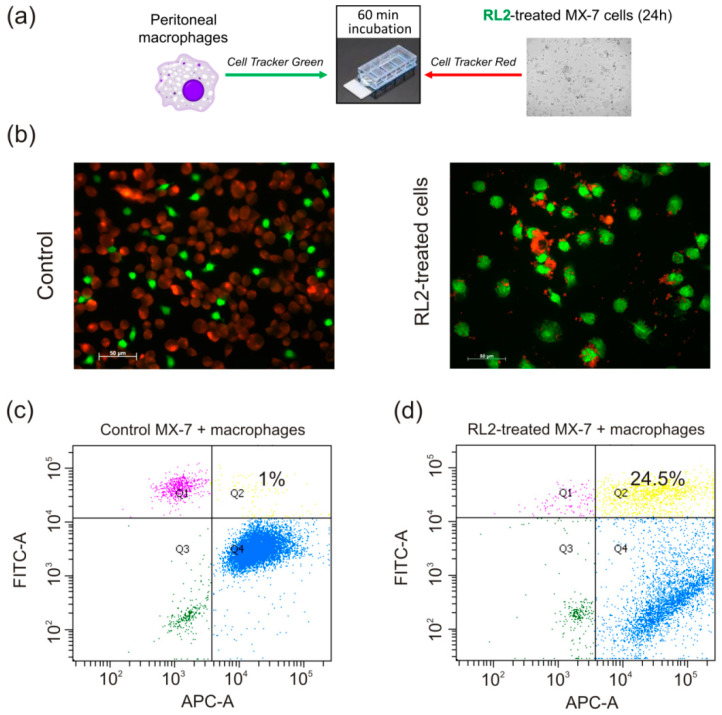
Figure 3.
Phagocytosis of RL2-treated cells. (a) Scheme of the experiment. (b) MX-7 cells (red) were treated with RL2 (0.3 mg/mL) for 24 h and next co-incubated with peritoneal macrophages (green) for 60 min. Representative images of four independent experiments are presented. (c,d). Flow cytometry analysis of double-positive green/red population. Percent of double positive population is indicated in Quadrant 2 (Q2). Representative images are presented.

