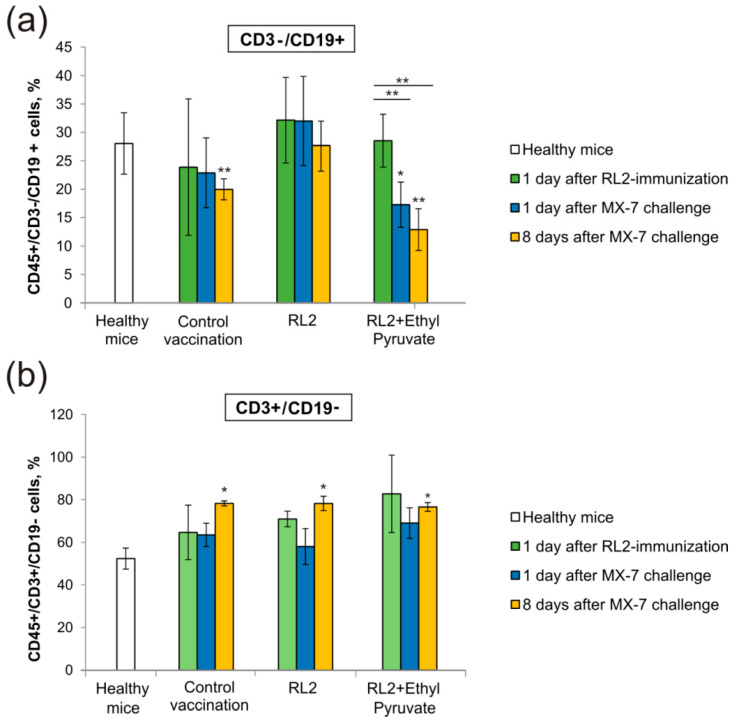
Figure 6.
Distribution of immune cell populations in peripheral blood. PBMCs were harvested from whole blood samples, stained with CD45, CD3, and CD19 markers, and analyzed by flow cytometry. The number of positive cells is shown as a percentage of total blood CD45+ lymphocytes. (a) B-lymphocytes; (b) T-lymphocytes. Healthy mice were used as a negative control; “Control vaccination” mice were vaccinated with live MX-7 cells. Statistical differences between control and experimental groups are indicated by * for p < 0.05; ** for p < 0.01.

