Figure 5.
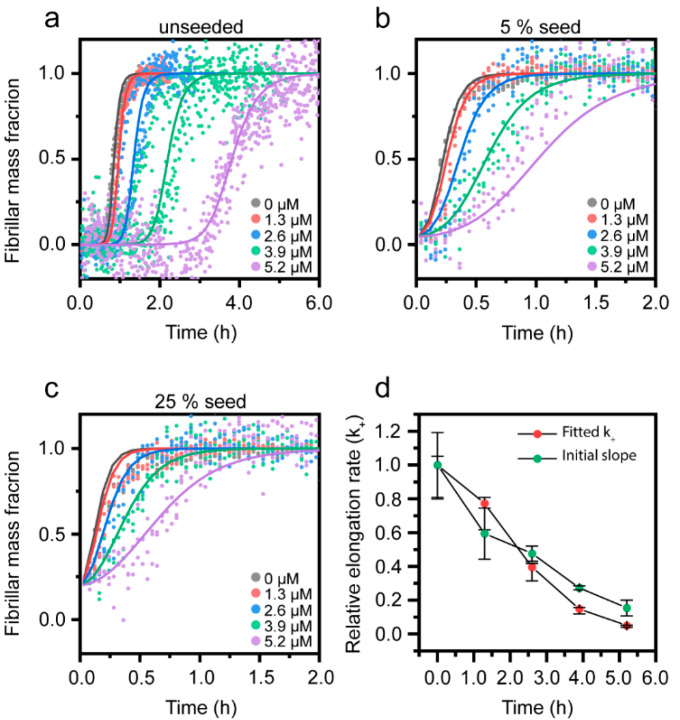
Fitting of the Aβ(1-42) aggregation kinetics in the presence of Cu2+ at pH 8.0 to mathematical models of amyloid formation. (a–c) Normalized kinetic profiles of 2.6 µM Aβ(1-42) at pH 8.0 corresponding to the data in Figure 4. Solid lines are the global fits to data using a model for Cu2+-dependent variation in the elongation rate constant (k+). (d) Relative change in the elongation rate constant (k+) determined from the fitting of the data in (a–c) compared to the relative rate determined via the linear approximation of the initial slope at 25% seeds in Figure 4e. All the rate constants are relative to that of 2.6 µM of Aβ(1-42) in the absence of Cu2+.

