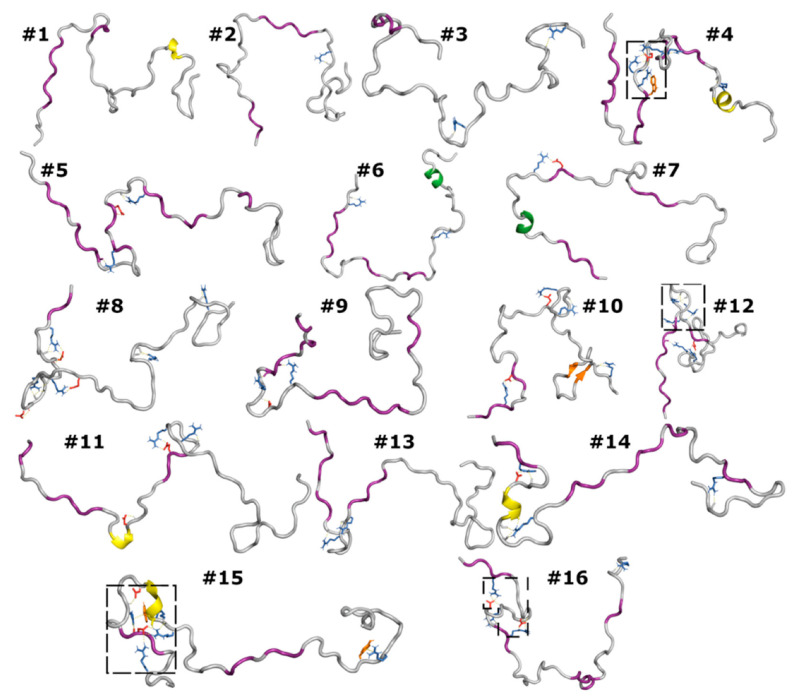
Figure 4.
Representative conformations from the MD simulations. Secondary structures are shown by the color of the backbone (PPII, 310, and hybrid 310-α helices in purple, yellow, and green respectively; β-sheet, orange). Cationic, anionic, and aromatic side chains involved in salt bridges, cation–π interactions, and SC-BB hydrogen bonds are shown in blue, red, and orange, respectively. Boxed regions, after enlargement, are shown in Figure 5.

