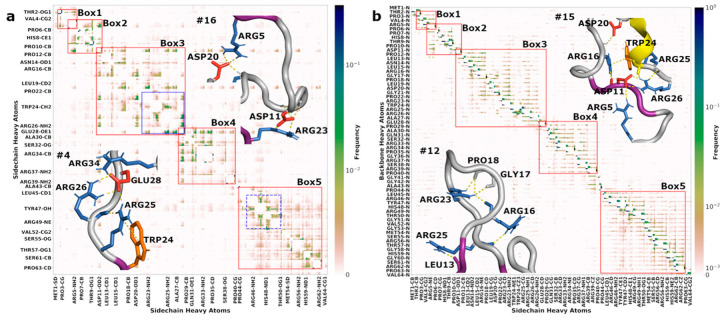
Figure 5.
Contact maps between (a) sidechain–sidechain and (b) sidechain–backbone atom pairs. Normalized contact frequencies are shown as color gradients, which follow a linear scale for contact frequencies between 0 and 0.01 but a logarithmic scale above 0.01. Red boxes indicate segments of residues that frequently form contacts. Blue boxes (solid, residues 23–28; dash, 46–50) highlight residues with particularly high contact frequencies. See an enlarged view of Box 3 and Box 5 in Figure S7. Enlarged views of regions from four conformations (#4, #12, #15, and #16) in Figure 4 are shown as insets to illustrate SC-SC and SC-BB interactions.

