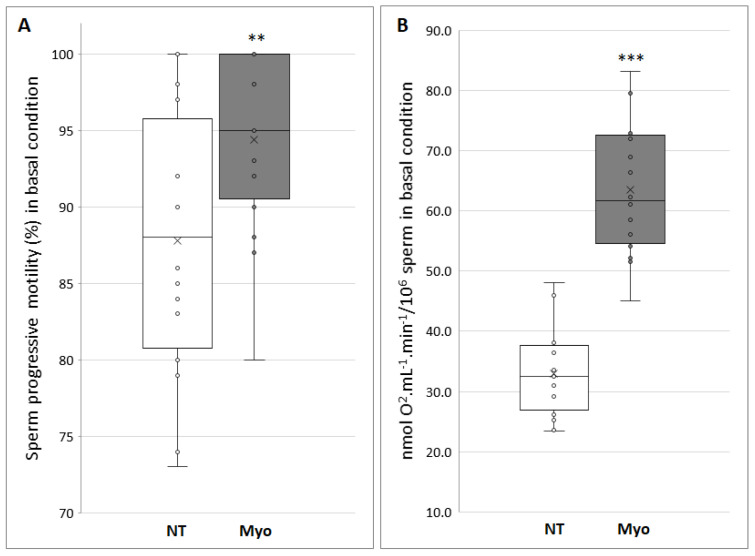
Figure 2.
(A) Progressive motility of capacitated spermatozoa (NT, not treated) and treated with 20 mg/mL of myo-inositol (Myo) (**p < 0.01). (B) Oxygen consumption, expressed as nmol O2·mL−1·min−1 on 10 million sperm cells, of control spermatozoa (NT, not treated) respect to treatment with myo-inositol (Myo) at a dose of 20 mg/mL (***p < 0.001). Graphical diagrams are plotted as box–whisker plots, where boxes show the interquartile range with median and mean values, and whiskers represent min and max confidence intervals.

