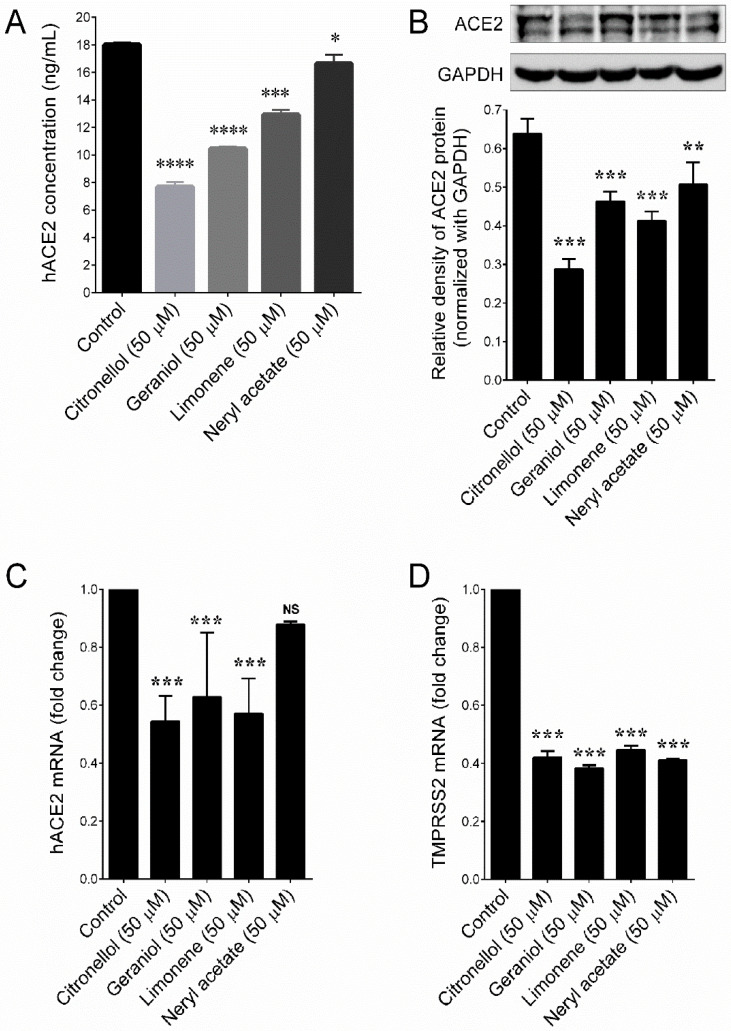
Figure 4.
ACE2 inhibitory effects of major compounds of geranium and lemon essential oils. (A) ACE2 activity in HT-29 cells were determined by ELISA assay. (B) Protein expression levels of ACE2 were determined by immunoblotting. Relative density of one representative experiment is shown, where ACE2 signal was normalized to GAPDH signal. (C,D) Relative expression of ACE2 and TMPRSS2 mRNAs in HT-29 cells. Values represent the mean ± SD of three independent experiments. p-values of less than 0.05 *, 0.01 **, 0.001 ***, and 0.0001 **** were considered statistically significant for the sample treatment group vs. the control group.

