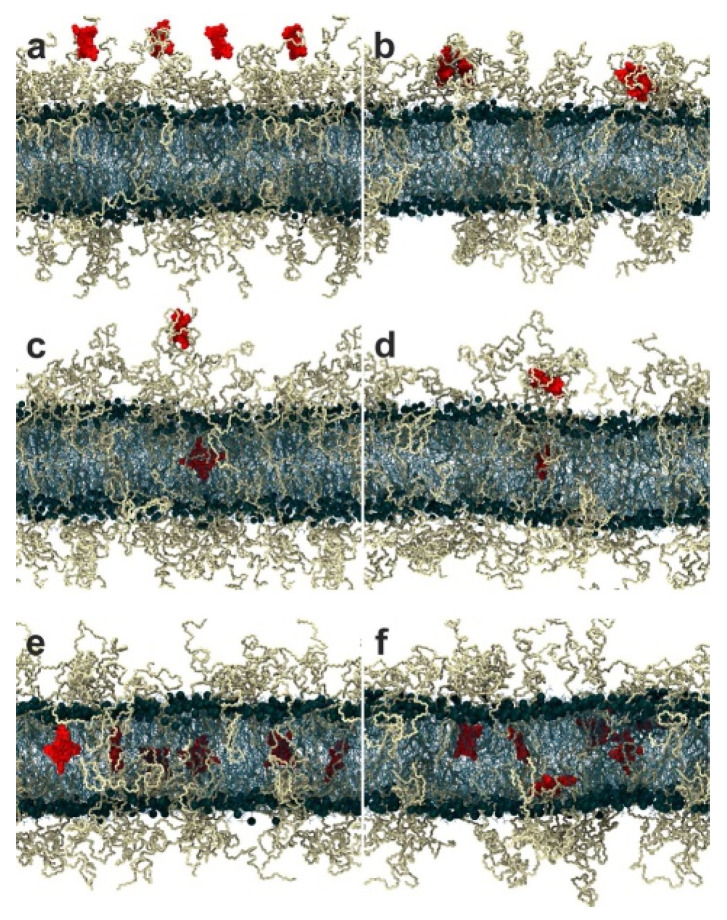
Figure 6.
Snapshots of simulations showing the penetration of hydrophobic porphyrins into the PEGylated lipid bilayer as a function of time: four porphyrins at 0 ns (a) and 100 ns (b); two porphyrins at 0 ns (c) and 350 ns (d); six porphyrins at 0 ns (e) and 350 ns (f) (reprinted with permission from [154]. Copyright (2015) American Chemical Society).

