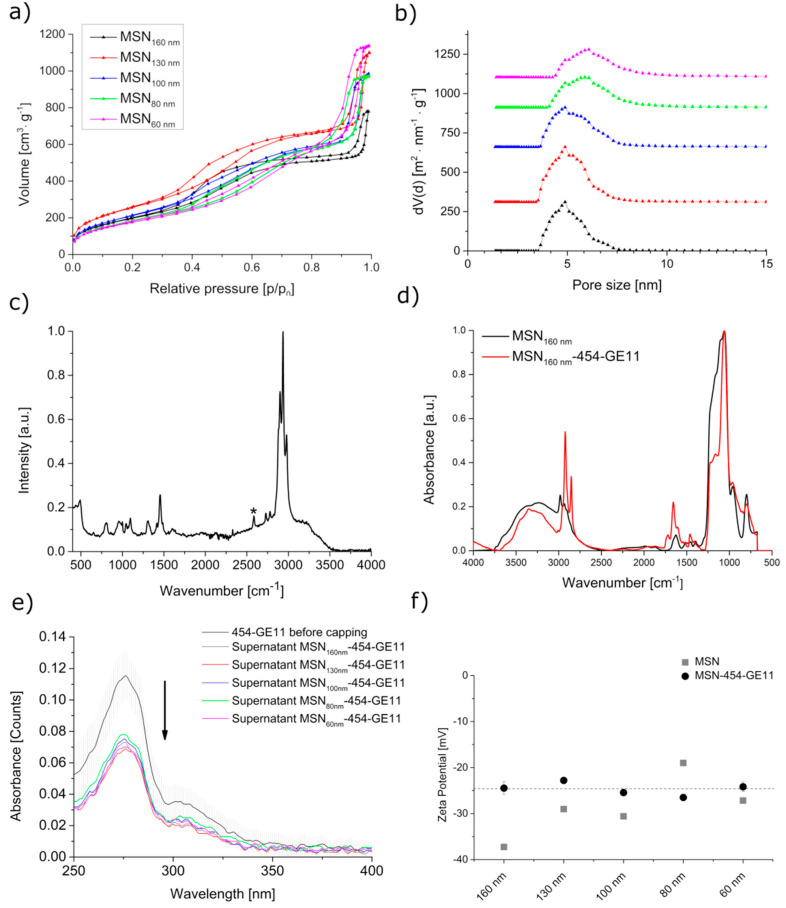
Figure 3.
Characterization of MSN and MSN-454-GE11. (a) Nitrogen sorption isotherms and (b) corresponding pore size distributions. For clarity, the pore size distribution curves in panel b are shifted along the y-axis. (c) Raman spectrum of MSN160 nm. The signal at 2580 cm−1 (indicated by *) indicates the presence of thiol groups. (d) IR spectra, (e) UV VIS spectra of the capping solution before capping (black line) and the supernatants after capping, and (f) zeta potential measurements of MSN and MSN-454-GE11 at pH = 7.3.

