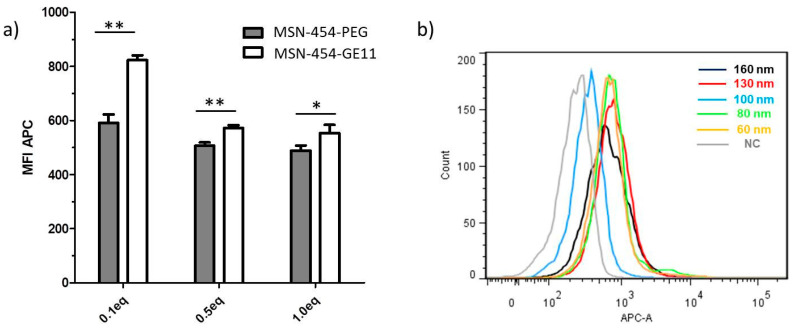
Figure 4.
Cellular internalization determined by flow cytometry. Cells were incubated for 45 min, washed and analyzed. (a) MSN160 nm-454-PEG was used for passive and MSN160 nm-454-GE11 for receptor-mediated uptake. 454 was functionalized with different equivalents of Mal-PEG (454-PEG) and Mal-PEG-GE11 reagent (454-GE11), respectively, in the range from 0.1 to 1 eq. The mean fluorescence intensity of the Atto-633 signal (MFI APC) represents the amount of internalized nanoparticles. A high MFI corresponds to a large cell uptake of MSN. For statistical analysis, a two-tailed t-test was performed (n = 3, mean ± SD, * p < 0.05, ** p < 0.01) (b) Histograms of cellular internalization of Atto-633 labeled MSN-454-GE11 after 45 min incubation with particle sizes in the range of 160 nm to 60 nm and negative control (NC). The Atto-633 intensity (APC-A channel) is plotted against the number of events detected (‘count’). ‘Count’ represents cumulative counts of cells with indicated Atto-633 fluorescence after appropriate gating by forward/sideward scatter and pulse width. For statistical analysis, see Figure S7.

