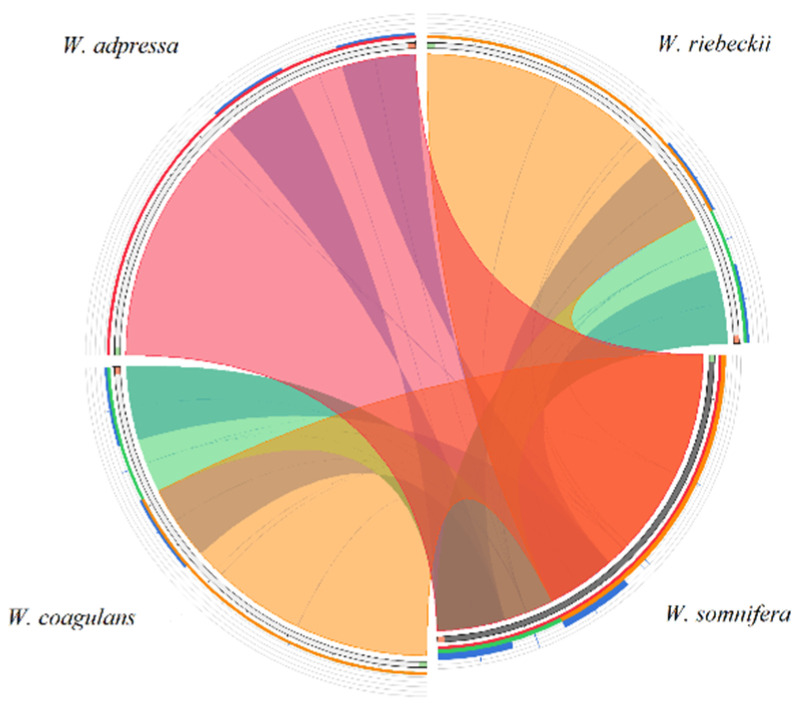
Figure 1.
Structural comparison of Withania plastomes showing a high level of synteny and the lack of large rearrangements. The start and end points of the sequences are marked by green and orange blocks. The colored blocks outside the sequences refer to the score/max bit core ration, with green ≤ 0.50, orange ≤ 0.75, and red > 0.75. Blue blocks and chords represent the inverted repeats (IRs).

