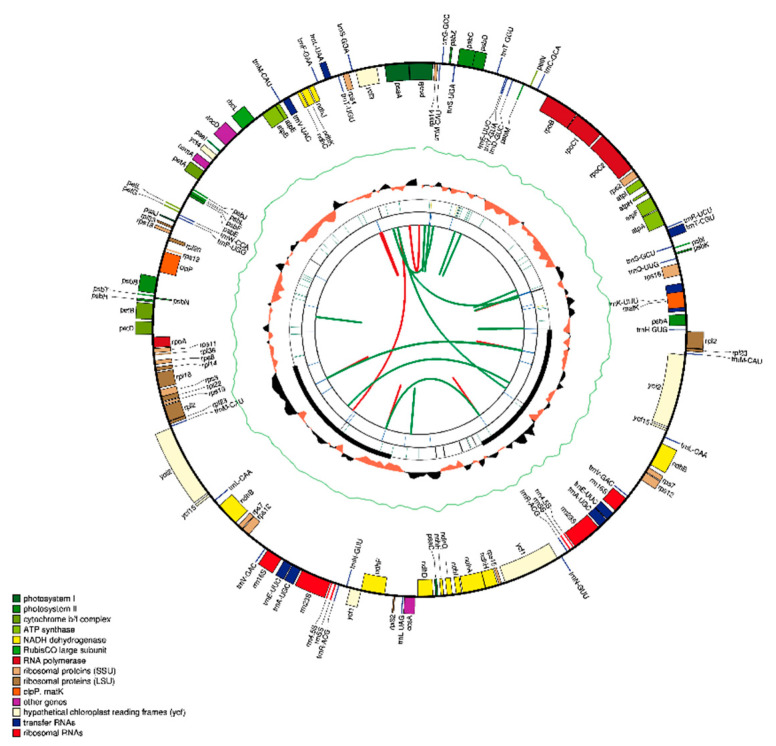
Figure 2.
Consensus circular genome map of Withania plastomes. The first larger ring represents the gene structure of the chloroplast genome. The GC content is plotted as a green line while a skewed GC plot is presented as an orange/black track around the inner circles. The second ring is displaying the IRs as longer black boxes, while tandem repeats are represented by short bars. The third, and last circle shows the output of MISA microsatellite detection, where reverse repeats are connected with green arcs, while red arcs represent forward repeats.

