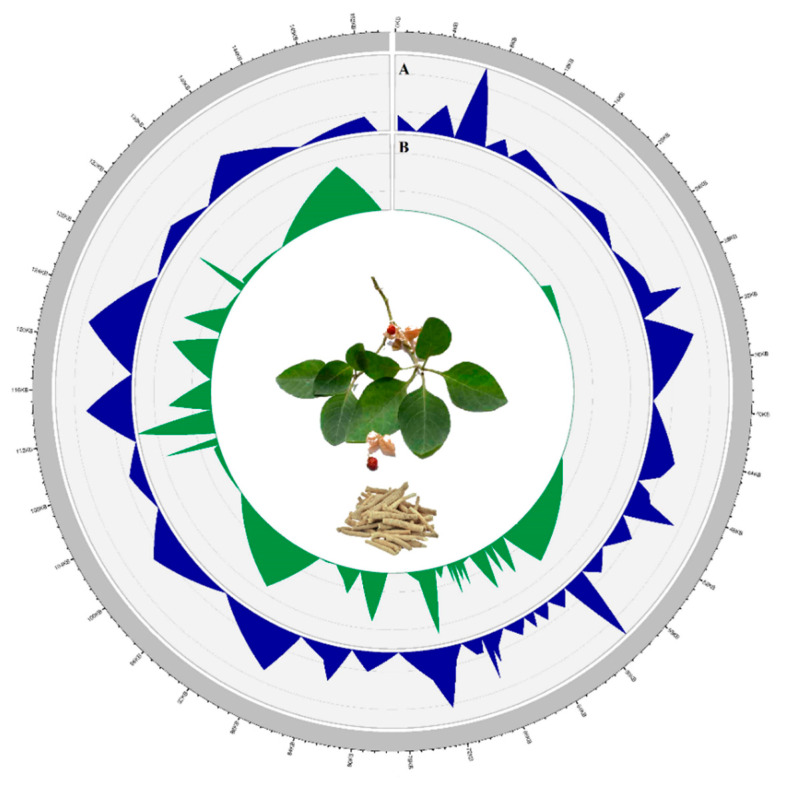
Figure 4.
Circular visualization of the distribution of polymorphisms among Withania species. The plastome is shown as a size-proportioned (bp) grey bar in the outer circle. In the inner circle, the values of the (A) average number of nucleotide differences per site or nucleotide diversity (π) and (B) indel diversity are shown with a 100 bp window size.

