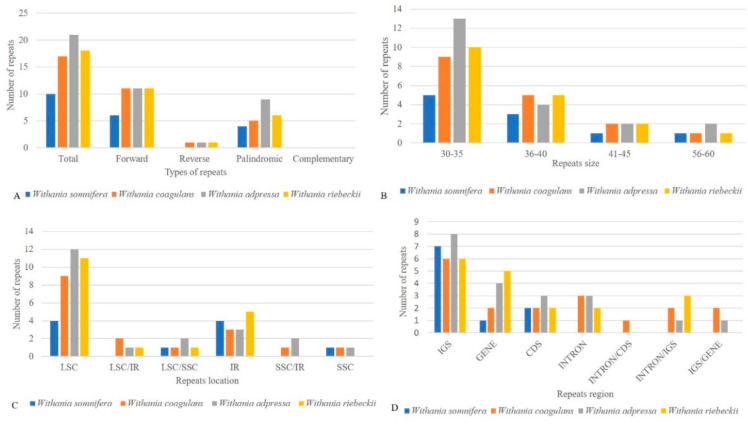
Figure 6.
(A) The total number of oligonucleotide repeats among Withania species and their distribution according to specific characteristics. (B) The distribution of repeats in size ranges. (C) The number of repeats grouped according to their location in each structural region (D) The distribution of repeats in intergenic spacer regions (IGS), genes, coding DNA sequences (CDS), and introns and their proportionate occurrence.

