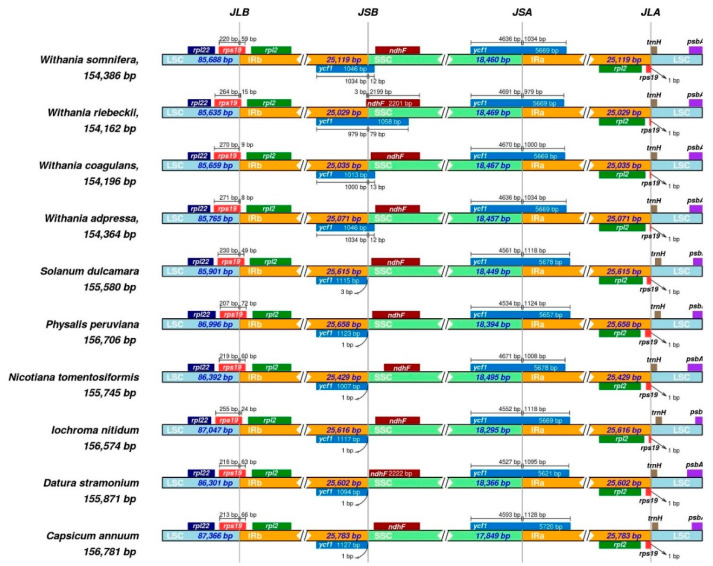
Figure 8.
The comparative assessment of junction sites among six Withania species and six outgroups of Solanaceae. Genes are represented by boxes above (negative-strand) and below (positive-strand) the proportionate line. The size of each gene and their relative position at the junctions are shown in base pairs (bp). The figure shows the conservation of the junctions among Withania species with mild shifts at the JSB (IRb/SSC).

