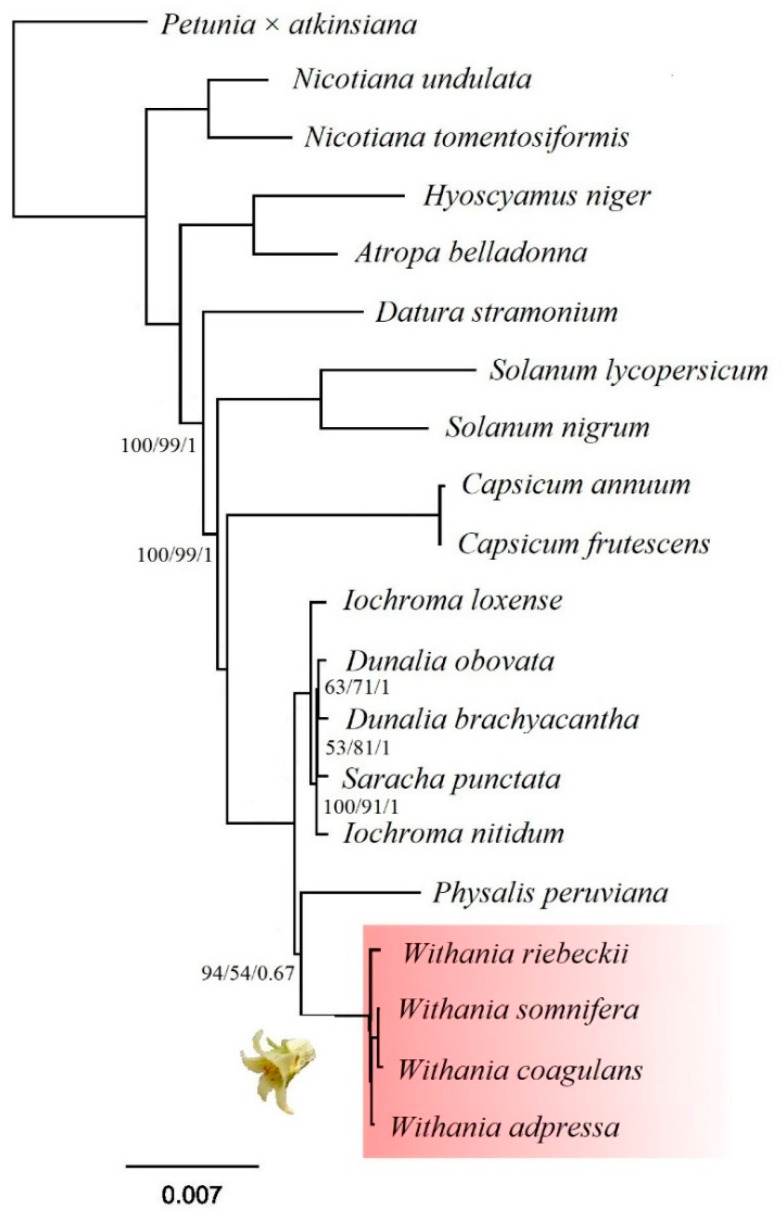
Figure 9.
Maximum likelihood (ML) tree reconstructed among 19 species of Solanaceae based on 74 protein-coding genes. Bootstrap, SH-aLRT values and Bayesian posterior probabilities are indicated at each node as UFBoot/SH-aLRT/PP. Unmarked nodes have maximum support values. The scale bar is proportional to substitution per site.

