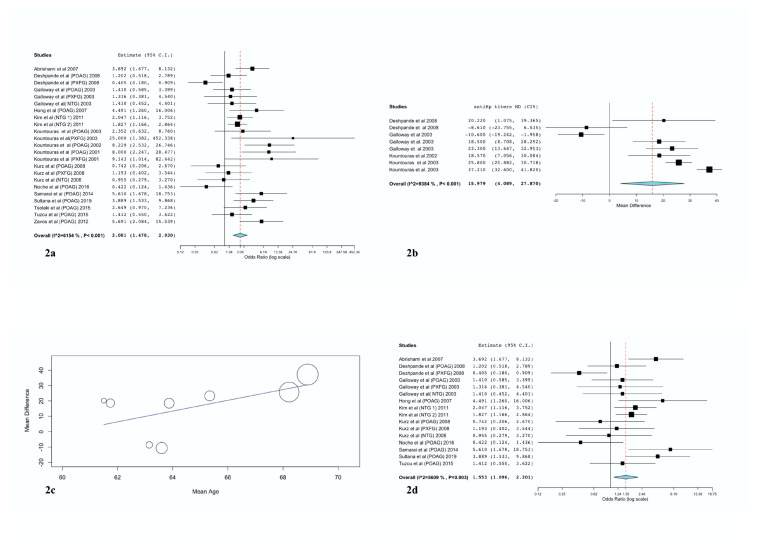
Figure 2.
(a) Forest plot illustrating, in OR, the overall and per included study association between H. pylori infection and glaucoma risk. (b) Forest plot for the association between means of difference of anti- H. pylori antibodies titers and glaucoma occurrence. (c) Meta-regression scatter plot indicating the relationship between the means of difference of anti-H. pylori antibodies titers and glaucoma risk after adjustment for mean age. (d) Sensitivity analysis excluding our group’s studies and confirming the absence of bias because of our own studies. CI, confidence interval; H. pylori; Helicobacter pylori; NTG, normal tension glaucoma; OR, odds ratio; POAG, primary open angle glaucoma; PEG, pseudo-exfoliation glaucoma; MD, weighted mean differences.

