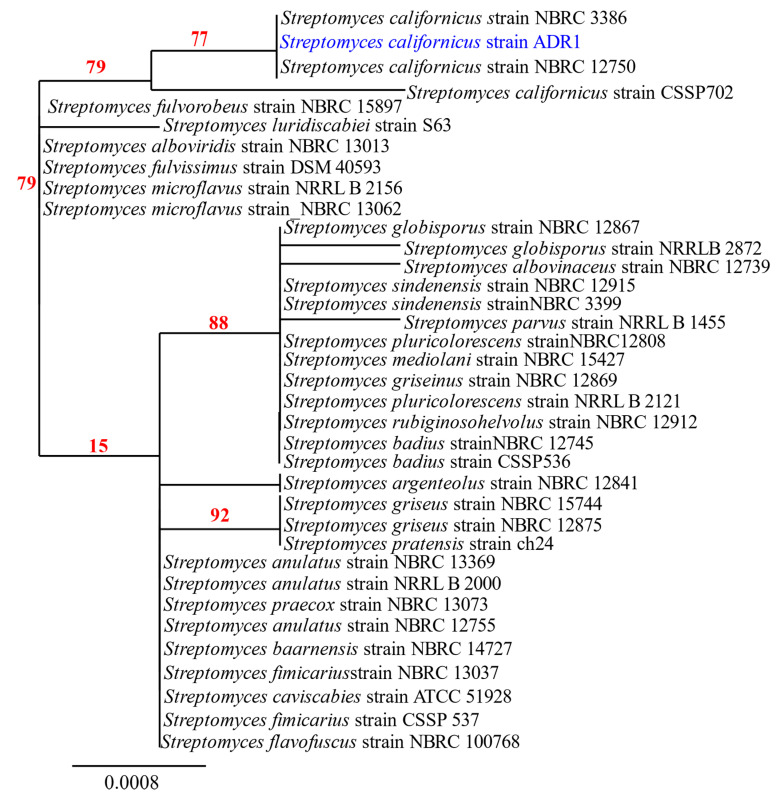
Figure 1.
Phylogenetic analysis of isolate ADR1. Neighbour-joining phylogenetic tree showed maximum likelihood model showing the phylogenetic relationship of selected isolate (highlighted in blue) based on 16S rRNA gene sequence alignments. The numbers at the branching points are the percentages of occurrence in 500 bootstrapped trees. Bar indicated 0.0008 substitutions per nucleotide position.

