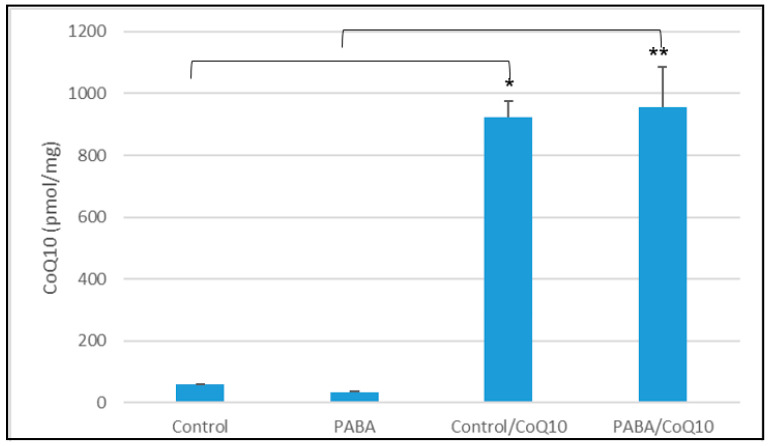
Figure 3.
The cellular CoQ10 concentration, after treatment with 5 µM CoQ10 over 3 days. Figure shows concentration of CoQ10 after PABA treatment and subsequent CoQ10 treatment. CoQ10 concentration standardised to protein baseline (mg of protein). Comparison of groups was carried out as follows: control group vs. PABA, Control group vs. Control CoQ10 treated, PABA group vs. PABA CoQ10 treated. Data available in supplemental data under Table S3. Level of significance * p < 0.05, ** p < 0.05; n = 26.

