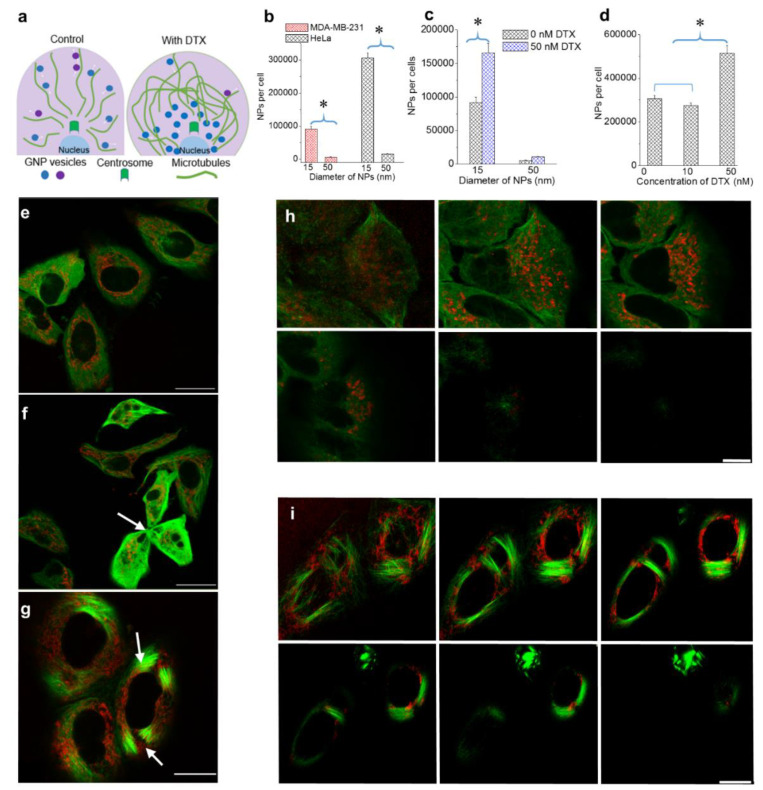
Figure 2.
The effect of NP size and DTX concentration on intracellular NP accumulation. (a) Schematic diagram highlighting differences in the MT network and NP distribution in the absence and presence of DTX. (b) Size-dependent uptake of NPs in MDA-MB-231 and HeLa cells. (c) Size-dependent uptake of NPs in the presence of a 50 nm DTX concentration in MDA-MB-231 cells. (d) DTX concentration dependent NP uptake in MDA-MB-231 and HeLa cells. (e–g) Images showing NPs and the MT network in cells treated with 0, 10, and 50 nM of DTX, respectively (f): arrow indicates cell fragmentation during division; g: arrows indicate bundling of MTs). (h–i) Z-stack showing the distribution of NPs and the MT network in a group of cells treated with 0 and 50 nM DTX, respectively. Vesicles containing GNPs and MTs are marked in red and green, respectively. Scale bar is 20 µm. Error bars are standard deviations from 3 replicate measurements. * Represents a statistically significant difference (Welch’s unequal variance t-test, p < 0.05).

