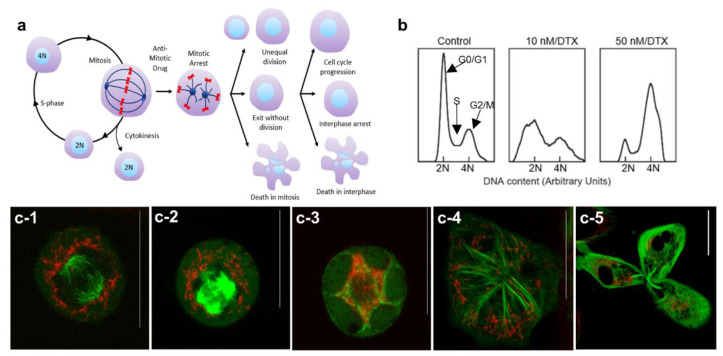
Figure 3.
Distribution of NPs during cell division in the presence of DTX. (a) Schematic diagram illustrating the different outcomes of cell division in the presence of the antimitotic drug, DTX. (b) Cell cycle analysis for control cells and cells treated with 10 and 50 nM concentrations of DTX. (c) Distribution of NPs in a control cell (c-1), cells treated with 50 nM DTX (c-2–c-4) and in a cell treated with 10 nM DTX (c-5). Vesicles containing GNPs and MTs are marked in red and green, respectively. Scale bars are 20 µm.

