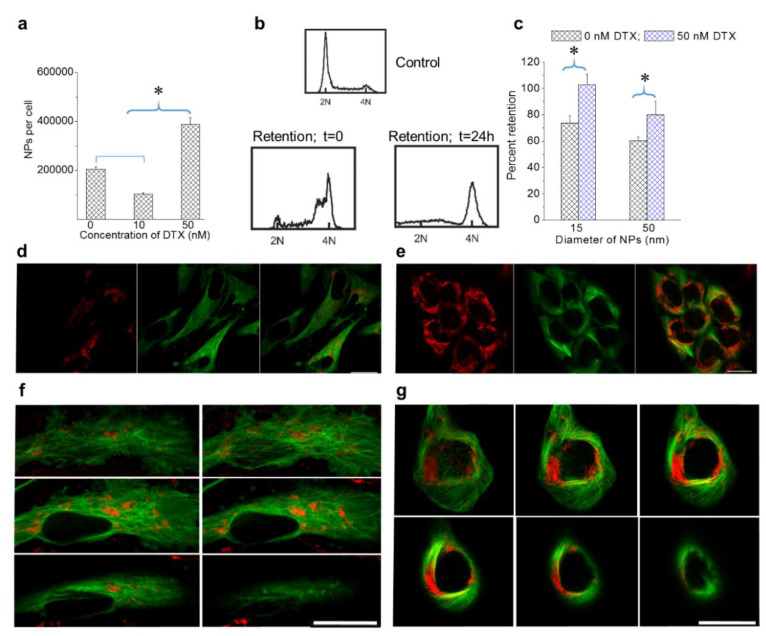
Figure 4.
Retention of NPs in cells treated with DTX. (a) Retention of NPs in DTX-treated cells after 24 h. (b) Cell cycle analysis for control HeLa cells and cells treated with 50 nM DTX at the beginning and end of the retention. (c) NP size-dependent retention in MDA-MB-231 cells treated with 50 nM DTX. (d,e) Images corresponding to control cells and cells treated with 50 nM DTX after 24 h, respectively. (f,g) Z-stack showing the distribution of NPs in different planes following the retention process in a control cell and a cell treated with 50 nM DTX, respectively. Vesicles containing GNPs and MTs are marked in red and green, respectively. Scale bar is 20 µm. Error bars are standard deviations from 3 replicate measurements. * Represents a statistically significant difference (Welch’s unequal variance t-test, p < 0.05).

