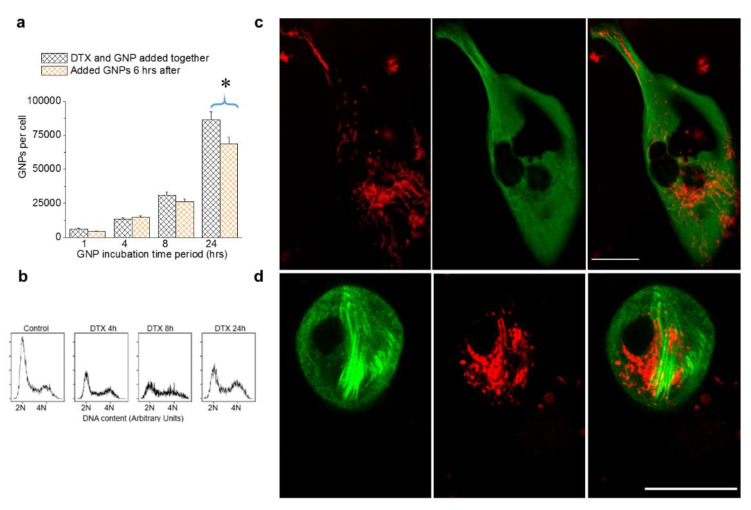
Figure 6.
The relative timing of DTX and GNP inoculation in MDA-MB-231 cells treated with 0 and 50 nM DTX. (a) Variation in intracellular GNP accumulation with simultaneous addition of GNP and DTX vs. GNPs added 6 hrs after the addition of DTX. (b) Cell cycle analysis for control cells and cells treated with 50 nM DTX after 4, 8, and 24 h. (c,d) Images of individual cells treated with 0 and 50 nM DTX, respectively. Vesicles containing GNPs and MTs are marked in red and green, respectively. Scale bar is 20 µm. Error bars are standard deviations from 3 replicate measurements. * Represents a statistically significant difference (Welch’s unequal variance t-test, p < 0.05).

