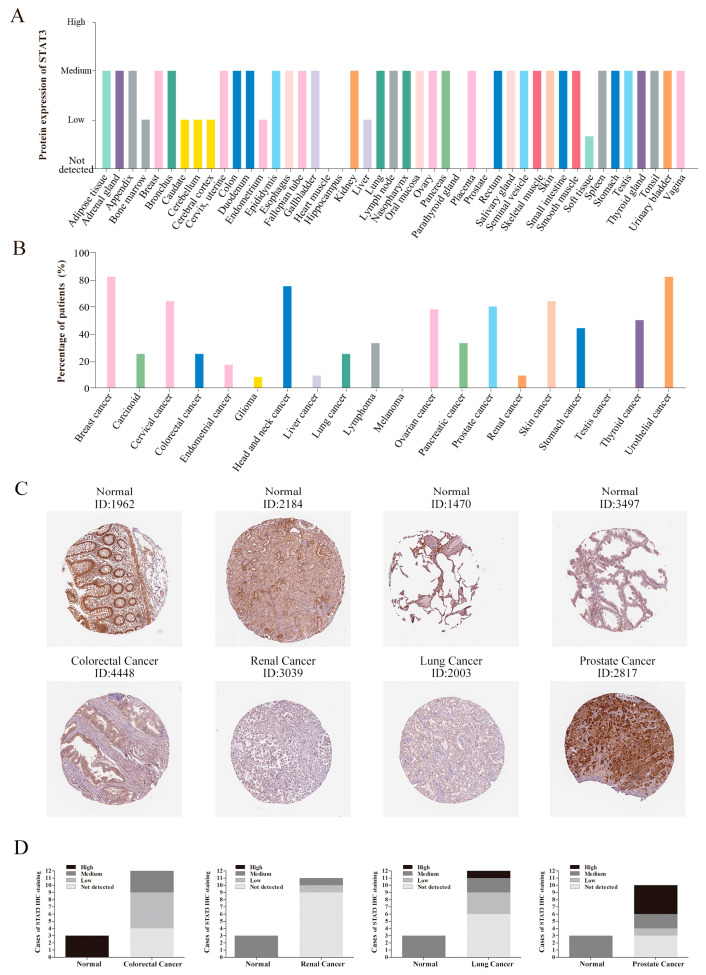
Figure 2.
The protein expression of STAT3 in normal and cancer tissues. (A) The protein expression of STAT3 in human normal tissues. (B) The percentage of patients with high and medium STAT3 protein expression levels in different cancer types. The blank bar represents low or not detected protein expression. (C) Immunohistochemistry images of STAT3 in colorectal cancer, renal cancer, lung cancer, prostate cancer, and normal tissues detected in the HPA database. (D) Statistical analysis of STAT3 immunohistochemical staining data in normal tissues (n = 3) and colorectal cancer (n = 12, p = 0.007), renal cancer (n = 11, p = 0.006), lung cancer (n = 12, p = NS), prostate cancer (n = 10, p = NS) tissues.

